Graphic
Radon levels and distance to a certified mitigator
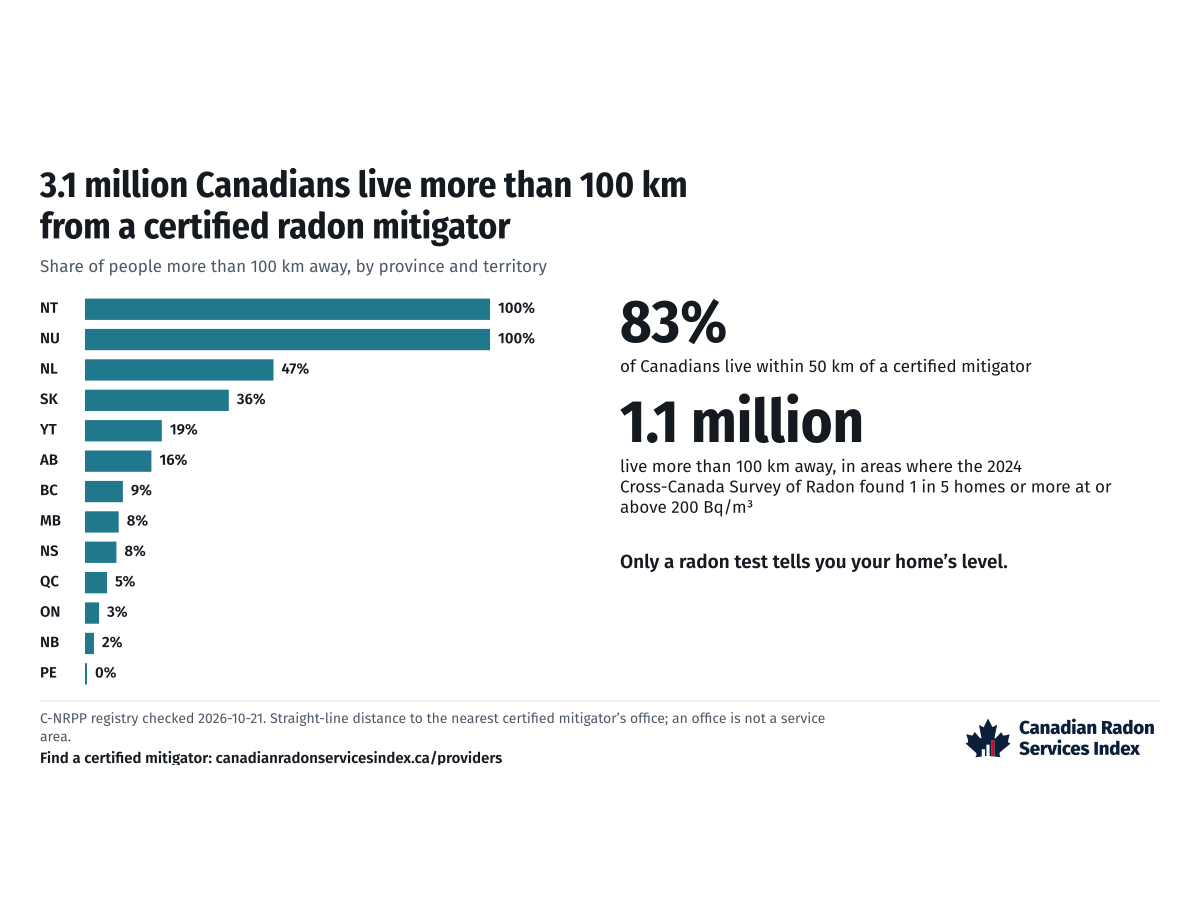
How many Canadians live far from a C-NRPP certified radon mitigator, by province and territory, with the share of homes over the guideline beside it.
Updated 2026-10-21
Infographics drawn from the Index’s radon data, each with embed code, image downloads in two sizes, the credit line to use and the date it last changed.
Each graphic’s page gives embed code, PNG and SVG downloads, the credit line, what the licence allows and when it last changed. Each graphic is redrawn when its data changes, and an embedded copy loads from our site and shows the current version. Some graphics may be reused under the CC BY 4.0 licence and some are for embedding only, because of where their data comes from. The cards are in alphabetical order by title.
Graphic
How many Canadians live far from a C-NRPP certified radon mitigator, by province and territory, with the share of homes over the guideline beside it.
Updated 2026-10-21
Graphic
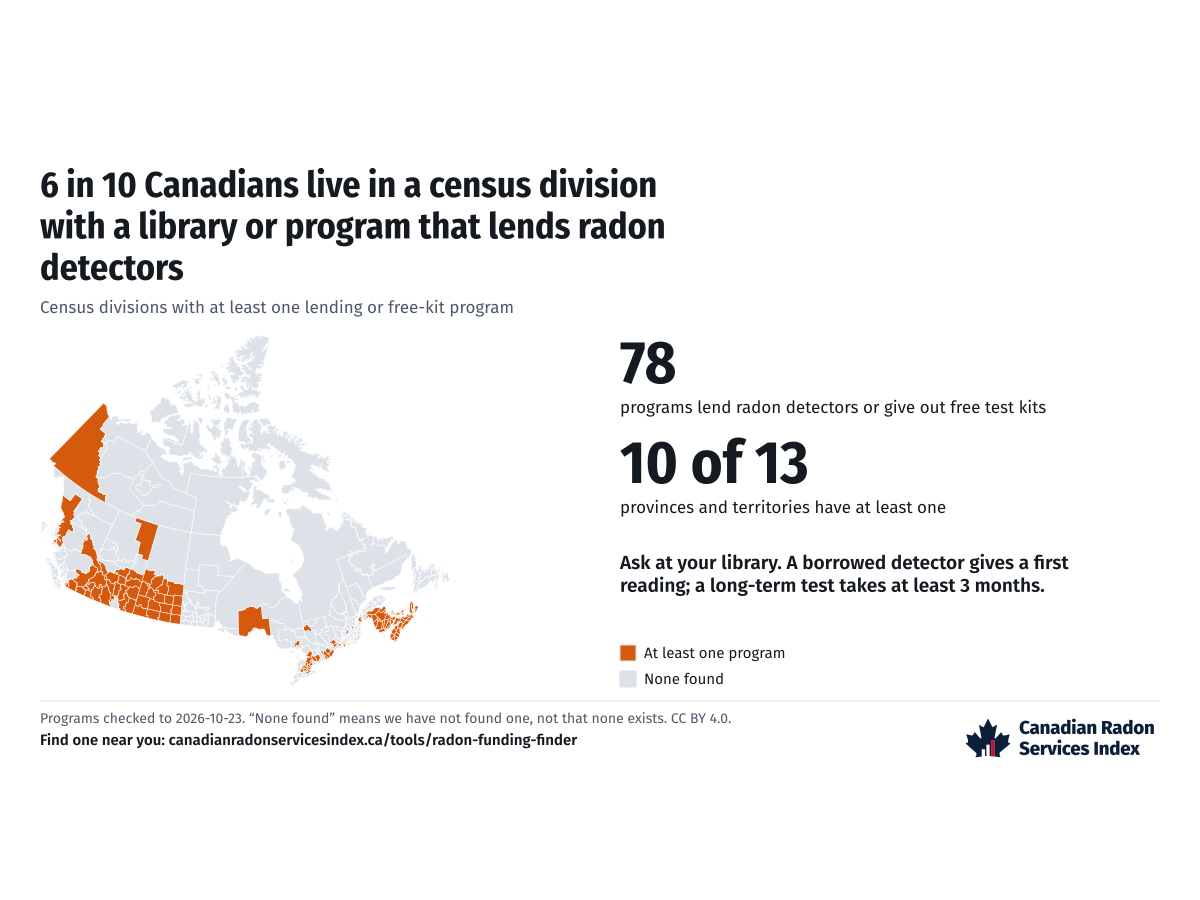
Where Canadians can borrow a radon detector or get a free test kit, by census division and by province.
Updated 2026-10-23
See something wrong? Report it.