Graphic
Radon levels and distance to a certified mitigator
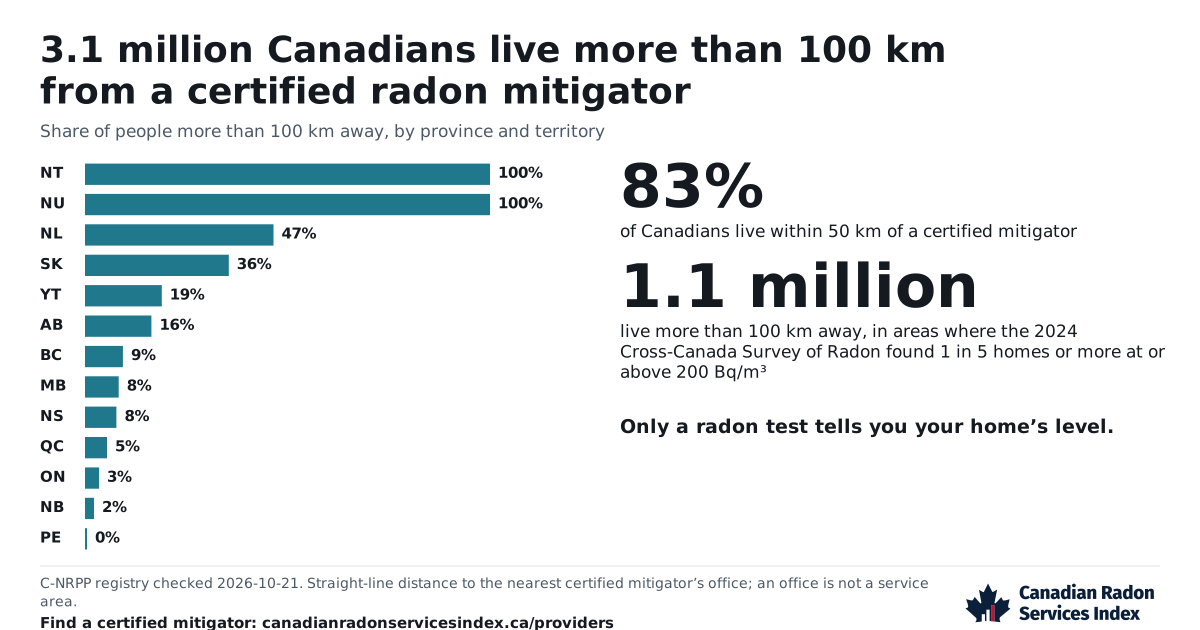
How many Canadians live more than 100 km from a C-NRPP certified radon mitigator, by province, with the survey’s radon levels beside it. Share, embed or download it.
The graphic
How to use this graphic
Embed code
<a href="https://canadianradonservicesindex.ca/data/graphics/radon-and-distance-to-a-mitigator/?utm_source=embed&utm_medium=referral&utm_campaign=radon-and-distance-to-a-mitigator">
  <img src="https://canadianradonservicesindex.ca/data/graphics/radon-and-distance-to-a-mitigator.svg" width="1200" height="630" alt="Radon levels and distance to a certified mitigator, Canadian Radon Services Index" style="max-width:100%;height:auto">
</a>Select the code to copy it if scripts are off.
- PNGradon-and-distance-to-a-mitigator.png
Wide, for articles and web pages · 1200 × 630 pixels · updated 2026-10-21
- SVGradon-and-distance-to-a-mitigator.svg
Wide, for articles and web pages · Scales to any size · updated 2026-10-21
- PNGradon-and-distance-to-a-mitigator-square.png
Square, for social media · 1080 × 1080 pixels · updated 2026-10-21
- SVGradon-and-distance-to-a-mitigator-square.svg
Square, for social media · Scales to any size · updated 2026-10-21
Cite this
Canadian Radon Services Index (canadianradonservicesindex.ca), from the 2024 Cross-Canada Survey of Radon and the C-NRPP registry.
Select the text to copy it if scripts are off.
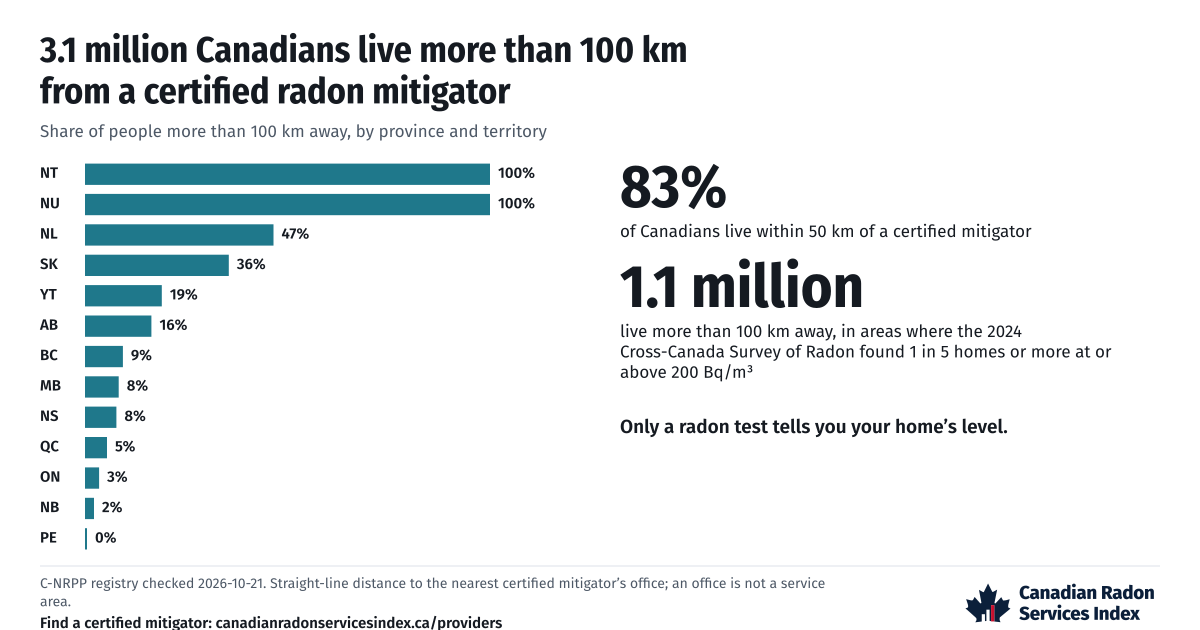
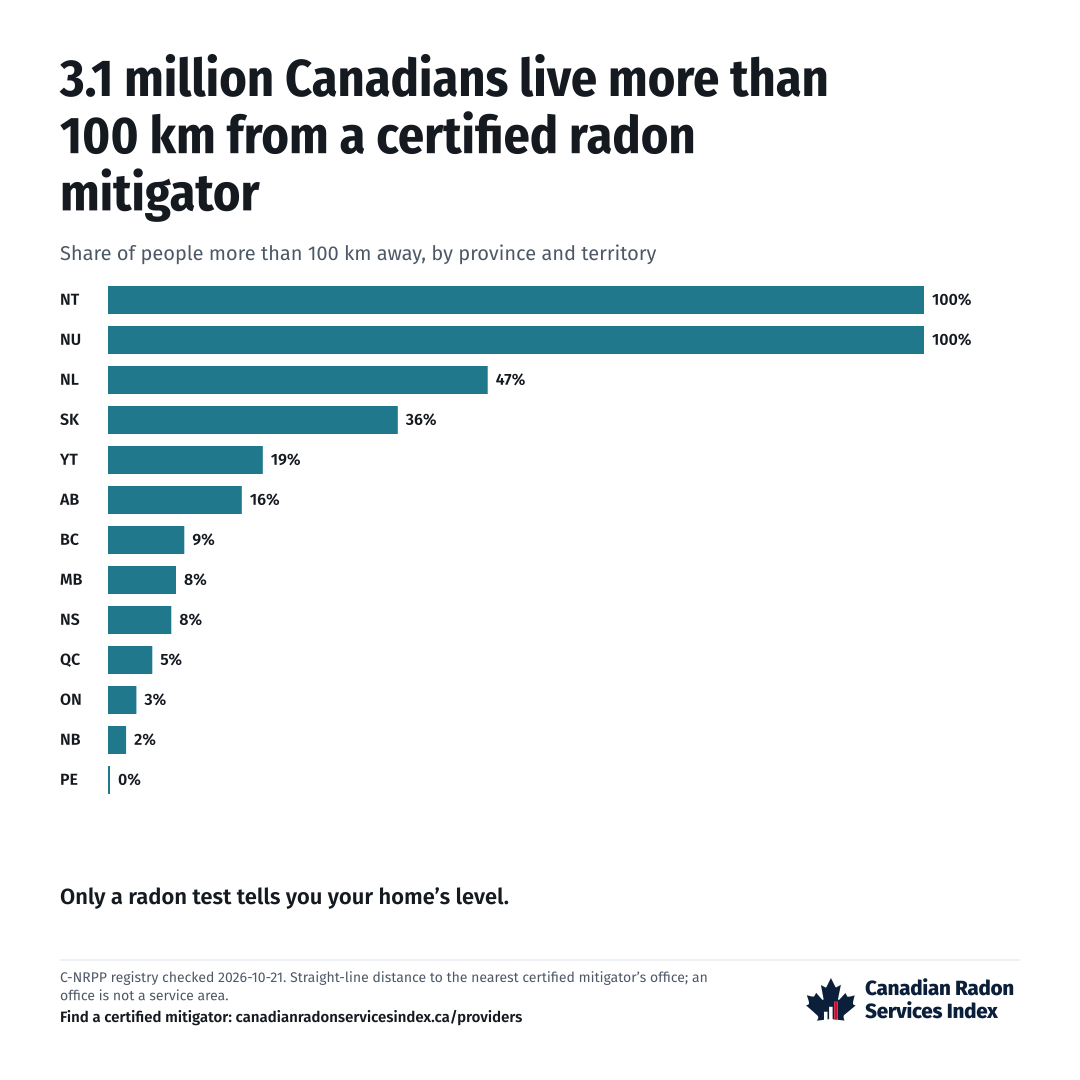
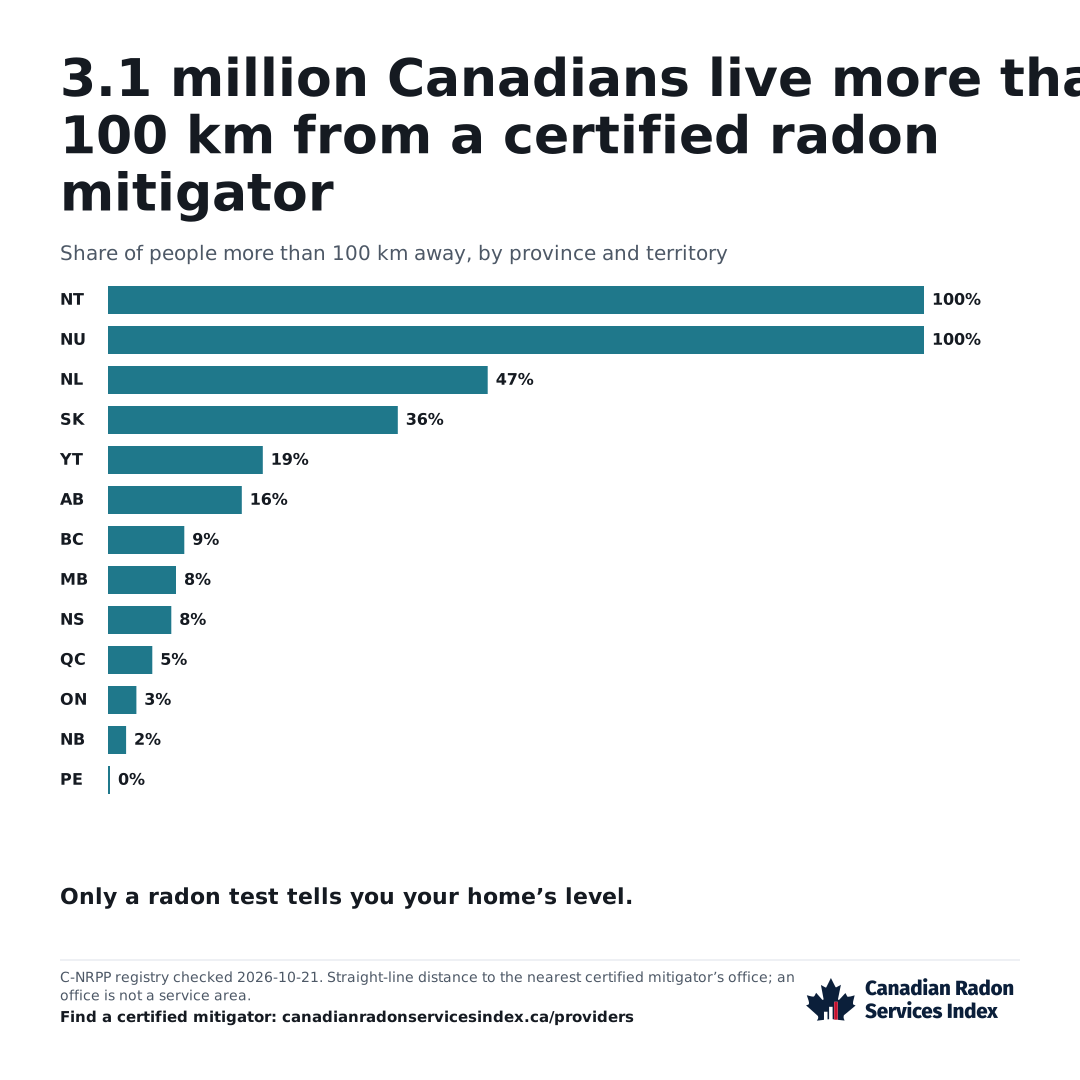
This graphic shows how many Canadians live more than 100 km from a certified radon mitigator. Bars break that down by province and territory. Two figures add the share of Canadians within 50 km of one, and the people more than 100 km away where radon is high. Its figures come from the latest monthly C-NRPP registry check, and we redraw it after each one.
The bars show where people live far from a certified mitigator
Each bar is the share of people in a province or territory who live more than 100 km away. We measure each census division in a straight line from where its people live to the nearest office of a business for hire with an active C-NRPP mitigation credential.
An office is not a service area, and businesses travel. A trip by road is longer. We place each office at the centre of its postal area. The table below lists divisions where under half the people live within 50 km of an office, highest radon share first.
The survey shows where radon is high
The radon figure counts people more than 100 km from a certified mitigator. It counts them only in census divisions where the 2024 Cross-Canada Survey of Radon found 1 in 5 homes or more at or above 200 Bq/m³. That is Health Canada’s guideline, the level at which it recommends lowering radon. It is measured as the yearly average in a part of the home people use.
Divisions in one survey reporting unit share a figure. The graphic says nothing about one home. Only a test tells you your home’s radon level.
Look up the survey figure for your area
You can embed it, and it stays current
You may embed the graphic or use the image with the credit line on this page. All other rights are reserved for now. The survey’s working group has not yet cleared its figures for reuse, and we have not yet set an open licence for data built from the C-NRPP registry.
The embedded copy loads from our site, so it shows the current graphic. The change log records each redraw. The page shows the check date and when the next is due.
Provenance
- Source
- 2024 Cross-Canada Survey of Radon, Version 1.1; C-NRPP Find a Professional directory, pulled 2026-10-21; Statistics Canada 2021 Census.
- Method
- Redrawn after each monthly check of the C-NRPP registry.
- Date checked
- 2026-10-21
- Next review
- 2026-11-01
The data behind the graphic
Census divisions where under 50% of people live within 50 km of a certified mitigator’s office, highest radon share first, as of 2026-10-21
Radon share: the survey’s share of homes at or above 200 Bq/m³ for the division’s reporting unit. Distance: from the division’s population-weighted centre.
| Census division | Province | Homes at or above 200 Bq/m³ | People within 50 km | Nearest mitigator, km | Population, 2021 |
|---|---|---|---|---|---|
| Division No. 16 | MB | 74.6% | 0% | 99 | 9,945 |
| Division No. 8 | MB | 74.6% | 0% | 85 | 13,877 |
| Division No. 17 | MB | 65.1% | 1% | 79 | 21,996 |
| Division No. 18 | MB | 65.1% | 11.2% | 87 | 26,636 |
| Division No. 9 | MB | 65.1% | 3.3% | 70 | 24,339 |
| Victoria | NB | 57.7% | 5.8% | 73 | 18,312 |
| La Côte-de-Gaspé | QC | 54.5% | 0% | 132 | 17,547 |
| Le Rocher-Percé | QC | 54.5% | 0% | 100 | 17,219 |
| Division No. 4 | MB | 52% | 23.9% | 65 | 9,665 |
| Division No. 6 | MB | 52% | 23.2% | 68 | 9,906 |
| Division No. 3 | SK | 51.5% | 4.9% | 127 | 12,262 |
| Division No. 4 | SK | 51.5% | 5.2% | 100 | 10,872 |
| Kenora | ON | 43.8% | 0% | 315 | 66,000 |
| Rainy River | ON | 43.8% | 0% | 291 | 19,437 |
| Division No. 10 | SK | 40.4% | 0% | 134 | 16,483 |
| Division No. 14 | SK | 40.4% | 0% | 205 | 35,428 |
| Madawaska | NB | 39.4% | 0% | 89 | 32,603 |
| Division No. 3 | AB | 35.9% | 6.8% | 130 | 40,768 |
| Division No. 1 | SK | 34.3% | 0% | 183 | 30,351 |
| Division No. 2 | SK | 34.3% | 0% | 100 | 22,497 |
| Columbia-Shuswap | BC | 32.5% | 30.3% | 45 | 57,021 |
| Papineau | QC | 31.5% | 32.6% | 58 | 24,308 |
| Division No. 12 | SK | 30.9% | 24.3% | 74 | 23,208 |
| Division No. 13 | SK | 30.9% | 0% | 171 | 22,047 |
| La Matanie | QC | 30.3% | 0% | 131 | 20,883 |
| La Matapédia | QC | 30.3% | 0% | 113 | 17,592 |
| La Mitis | QC | 30.3% | 0% | 118 | 18,363 |
| Division No. 2 | NL | 30.2% | 0% | 198 | 19,392 |
| Division No. 3 | NL | 30.2% | 0% | 275 | 13,920 |
| Division No. 4 | NL | 30.2% | 0% | 283 | 19,253 |
| Division No. 5 | NL | 30.2% | 0% | 367 | 40,396 |
| Division No. 6 | NL | 30.2% | 0% | 238 | 37,339 |
| Division No. 7 | NL | 30.2% | 0% | 121 | 33,044 |
| Division No. 8 | NL | 30.2% | 0% | 274 | 33,940 |
| Division No. 9 | NL | 30.2% | 0% | 448 | 14,733 |
| Division No. 9 | SK | 30% | 0% | 176 | 36,047 |
| Kamouraska | QC | 30% | 37.6% | 56 | 21,307 |
| L'Islet | QC | 30% | 0% | 92 | 17,598 |
| La Haute-Gaspésie | QC | 30% | 0% | 108 | 10,950 |
| Montmagny | QC | 30% | 16.7% | 58 | 22,481 |
| Division No. 7 | AB | 29.8% | 0% | 149 | 40,684 |
| Renfrew | ON | 29.2% | 28.2% | 81 | 106,365 |
| Division No. 5 | AB | 28.6% | 41.6% | 49 | 55,784 |
| Division No. 1 | MB | 28.4% | 2.2% | 57 | 20,114 |
| Division No. 16 | SK | 28.3% | 1.7% | 118 | 37,993 |
| Division No. 17 | SK | 28.3% | 0% | 237 | 47,834 |
| Les Etchemins | QC | 28.1% | 0% | 66 | 16,927 |
| Division No. 5 | SK | 27% | 0% | 147 | 31,583 |
| Division No. 15 | SK | 26.5% | 7.8% | 109 | 88,988 |
| Richmond | NS | 26.1% | 0% | 79 | 8,914 |
| Division No. 7 | SK | 26% | 5.6% | 82 | 47,413 |
| Division No. 4 | AB | 24.2% | 0% | 194 | 9,220 |
| Inverness | NS | 24.1% | 0% | 79 | 17,346 |
| Victoria | NS | 24.1% | 36.2% | 44 | 7,441 |
| Division No. 12 | AB | 23.5% | 0% | 173 | 67,483 |
| Rimouski-Neigette | QC | 23.1% | 0% | 90 | 57,191 |
| Cumberland | NS | 22.9% | 16.1% | 64 | 30,538 |
| Charlotte | NB | 22.4% | 1.8% | 87 | 26,015 |
| Division No. 14 | AB | 22.2% | 0% | 178 | 28,617 |
| Division No. 9 | AB | 22% | 5.3% | 76 | 20,569 |
| Division No. 13 | AB | 20.7% | 22.7% | 70 | 68,076 |
| Grey | ON | 20.6% | 35.7% | 51 | 100,905 |
| Communauté maritime des Îles-de-la-Madeleine | QC | 20.5% | 0% | 150 | 12,654 |
| Prince | PE | 20.5% | 26.6% | 65 | 46,234 |
| Stikine | BC | 19.4% | 0% | 196 | 683 |
| Division No. 15 | AB | 19.2% | 0.5% | 75 | 37,735 |
| Lambton | ON | 19% | 13.5% | 64 | 128,154 |
| Le Granit | QC | 18.9% | 26.5% | 57 | 21,948 |
| Division No. 10 | AB | 18.8% | 12.3% | 108 | 95,455 |
| Peterborough | ON | 18.3% | 9.3% | 64 | 147,681 |
| Division No. 2 | AB | 16.7% | 0% | 141 | 178,513 |
| Pictou | NS | 16.7% | 0% | 76 | 43,657 |
| Charlevoix | QC | 15.6% | 0% | 93 | 13,371 |
| Charlevoix-Est | QC | 15.6% | 4.6% | 69 | 15,409 |
| Bruce | ON | 14% | 35.1% | 50 | 73,396 |
| Algoma | ON | 13.3% | 0% | 233 | 113,777 |
| Cochrane | ON | 13.3% | 0% | 283 | 77,963 |
| Sudbury | ON | 13.3% | 29.3% | 40 | 22,368 |
| Timiskaming | ON | 13.3% | 0% | 169 | 31,424 |
| Shelburne | NS | 12.5% | 0% | 123 | 13,704 |
| Division No. 18 | SK | 11.5% | 0% | 377 | 35,986 |
| Division No. 1 | AB | 11.3% | 0% | 211 | 82,513 |
| Haliburton | ON | 11.1% | 0% | 99 | 20,571 |
| Huron | ON | 11.1% | 47.5% | 54 | 61,366 |
| Muskoka | ON | 11.1% | 21.8% | 67 | 66,674 |
| Peace River | BC | 11.1% | 0% | 269 | 61,532 |
| Division No. 17 | AB | 10.9% | 0% | 287 | 62,132 |
| Region 5 | NT | 10.9% | 0% | 460 | 6,279 |
| Region 6 | NT | 10.9% | 0% | 660 | 20,805 |
| Bulkley-Nechako | BC | 10.1% | 0% | 199 | 37,737 |
| Nipissing | ON | 10% | 0% | 117 | 84,716 |
| Parry Sound | ON | 10% | 0% | 123 | 46,909 |
| Abitibi-Ouest | QC | 8.3% | 0% | 290 | 20,526 |
| La Vallée-de-l'Or | QC | 8.3% | 0% | 237 | 43,347 |
| Pontiac | QC | 8.3% | 22.8% | 71 | 14,764 |
| Témiscamingue | QC | 8.3% | 0% | 162 | 16,132 |
| Central Coast | BC | 8.2% | 0% | 340 | 3,582 |
| Mount Waddington | BC | 8.2% | 0% | 331 | 10,839 |
| Cariboo | BC | 7.8% | 0% | 181 | 62,931 |
| La Tuque | QC | 7.7% | 0% | 163 | 15,038 |
| Le Domaine-du-Roy | QC | 7.7% | 0% | 80 | 31,095 |
| Mékinac | QC | 7.4% | 0% | 85 | 12,762 |
| Shawinigan | QC | 7.4% | 0% | 101 | 49,620 |
| Kitimat-Stikine | BC | 7.1% | 0% | 385 | 37,790 |
| Division No. 18 | AB | 6.8% | 0% | 288 | 13,226 |
| Division No. 19 | AB | 6.8% | 0% | 312 | 121,167 |
| Antigonish | NS | 6.2% | 0% | 105 | 20,129 |
| Division No. 10 | NL | 6.2% | 0% | 602 | 24,332 |
| Guysborough | NS | 6.2% | 0% | 137 | 7,373 |
| La Haute-Côte-Nord | QC | 6.2% | 0% | 81 | 10,278 |
| Manicouagan | QC | 6.2% | 0% | 173 | 30,158 |
| Minganie--Le Golfe-du-Saint-Laurent | QC | 6.2% | 0% | 414 | 9,849 |
| Sept-Rivières--Caniapiscau | QC | 6.2% | 0% | 265 | 38,240 |
| Strathcona | BC | 5.6% | 0% | 175 | 48,150 |
| Maria-Chapdelaine | QC | 5.4% | 0% | 93 | 24,149 |
| Nord-du-Québec | QC | 5.4% | 0% | 660 | 45,740 |
| Cowichan Valley | BC | 5.3% | 1% | 69 | 89,013 |
| Northern Rockies | BC | 4.8% | 0% | 548 | 4,478 |
| Arthabaska | QC | 4.7% | 29.5% | 53 | 74,348 |
| Matawinie | QC | 4% | 48.5% | 54 | 55,500 |
| Drummond | QC | 3.5% | 8.1% | 57 | 107,967 |
| D'Autray | QC | 3.2% | 44.4% | 54 | 44,080 |
| Maskinongé | QC | 3.2% | 0% | 93 | 37,292 |
| Rouyn-Noranda | QC | 3.2% | 0% | 247 | 42,313 |
| Bécancour | QC | 2.6% | 0% | 81 | 20,748 |
| Digby | NS | 2.6% | 0% | 114 | 17,062 |
| Nicolet-Yamaska | QC | 2.6% | 0% | 82 | 23,848 |
| Pierre-De Saurel | QC | 2.6% | 40.4% | 49 | 51,843 |
| Yarmouth | NS | 2.6% | 0% | 148 | 24,947 |
| Capital | BC | 1.8% | 0.3% | 92 | 415,451 |
| Comox Valley | BC | 1.6% | 0% | 141 | 72,445 |
| Squamish-Lillooet | BC | 1.1% | 25.8% | 82 | 50,496 |
| Nanaimo | BC | 1% | 1% | 70 | 170,367 |
| Abitibi | QC | 0% | 0% | 290 | 24,764 |
| Alberni-Clayoquot | BC | 0% | 0% | 137 | 33,521 |
| Francheville | QC | 0% | 0% | 96 | 158,343 |
| Powell River | BC | 0% | 0% | 116 | 21,496 |
| Skeena-Queen Charlotte | BC | 0% | 0% | 519 | 18,181 |
| Division No. 11 | NL | no data | 0% | 908 | 2,323 |
| Division No. 19 | MB | no data | 0% | 160 | 15,381 |
| Division No. 20 | MB | no data | 0% | 202 | 9,634 |
| Division No. 21 | MB | no data | 0% | 408 | 21,871 |
| Division No. 22 | MB | no data | 0% | 532 | 42,226 |
| Division No. 23 | MB | no data | 0% | 778 | 4,690 |
| Kitikmeot | NU | no data | 0% | 1,427 | 6,458 |
| Kivalliq | NU | no data | 0% | 1,296 | 11,045 |
| Manitoulin | ON | no data | 0% | 108 | 13,935 |
| Qikiqtaaluk | NU | no data | 0% | 1,995 | 19,355 |
| Region 1 | NT | no data | 0% | 893 | 6,205 |
| Region 2 | NT | no data | 0% | 698 | 2,259 |
| Region 3 | NT | no data | 0% | 758 | 2,650 |
| Region 4 | NT | no data | 0% | 730 | 2,872 |
| Restigouche | NB | no data | 39.4% | 61 | 30,700 |
First published.
Sources
- C-NRPP, Find a Professional directory: every province and territory searched for each of the six service types, de-duplicated by the registry's person id. Pulled on 2026-10-21.
- Cross-Canada Survey of Radon Exposure in the Residential Buildings of Urban and Rural Communities, 2024 Report, Version 1.1 (CCSR.24.1.1), released October 2024, ISSN 2818-8195. Cross-Canada Survey of Radon working group.
- Statistics Canada, 2021 Census of Population, table 98-10-0015-01, Population and dwelling counts: Canada, provinces and territories, census subdivisions and dissemination areas, and the 2021 dissemination area boundary file, adapted. This does not constitute an endorsement by Statistics Canada.
See something wrong? Report it.